Mechanistic insights on segregation from a complex physicist

The distribution of people of different income levels within urban areas is anything but random. Residential segregation is a palpable, undeniable reality to any observer of cities. The patterns of segregation are also extremely persistent over time: despite massive demographic changes and migration flows, the spatial arrangement of income groups within cities changes only very slowly. Why is this the case? Surprisingly, there are not many theoretical insights on the long-run drivers of residential segregation, and thus very little guidance about what policies should or should not do about it.

A recent excellent contribution by Rémi Louf takes a step forward in proposing much needed mechanistic insights on the patterns of urban segregation. In his work, he departs from the null case – an unsegregated city – against which observed segregation levels can be compared.  He then proposes a measure of segregation inspired on Marcon and Puech’s M-function of co-location, and a way to let a class structure emerge from the data (in  this way avoiding the need to impose arbitrary income cut-offs).

Among other things, he finds that “neighbourhoods are geographically more coherent as cities get larger, which corresponds in effect to an increased level of segregation as the size of the city increases.” Interestingly, this phenomenon seems to be more important for higher-income households than for other income groups.

In the preliminary findings from my study on income segregation in Brazil, I find strong support for these patterns. The level of segregation increases with income, so that individuals in the highest income category are far more segregated than any other income group, including the poorest. There also seems to be a strong, positive relationship between city size and income segregation levels.  An interesting way forward is to think about the relationship between density and the over-representation of the highest and lowest income categories in urban areas in developing countries. Ultimately, we need to understand how income segregation evolves with economic development.


Public transport expansions and informality

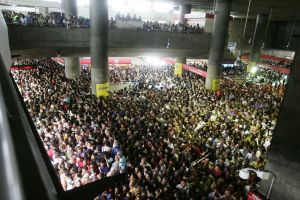
The São Paulo Metropolitan Region faces an acute deficit of public transport infrastructure, making commutes long and costly for workers. The difficulty in accessing jobs centers may translate into higher informality rates, since workers may be discouraged to take formal jobs, miss on information about job opportunities, or even be discriminated against according to  their place of residence.

Usuários lotam a plataforma da estação Sé do Metrô de São Paulo, sentido Corinthians-Itaquera

Sé metro station, Corinthians-Itaquera direction. Source: Viatrolebus

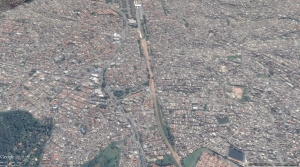
In a new working paper co-authored with Frederico R. Ramos, we estimate the impact of public transport expansions on local informality rates. An important part of the explanation for the large deficit in transport infrastructure are chronic project delays. We use this information in our methodological approach to compare areas that received new transport infrastructure with areas where new train/metro stations or bus corridors were planned, but eventually not built.

Example of areas with and without a bus corridor

Example of areas with (left) and without (right) a bus corridor. Source: Google Earth

After controlling for endogenous selection, we find this impact to be significant: informality rates decreased on average 16% faster in areas that received new transport infrastructure, compared to areas that faced project delays.

Graphical Presentation of Regression Discontinuity Results

The Political Methodologist

[Editor’s note: this post is contributed by Natalia Bueno and Guadalupe Tuñón.]

During the last decade, an increasing number of political scientists have turned to regression-discontinuity (RD) designs to estimate causal effects.  Although the growth of RD designs has stimulated a wide discussion about RD assumptions and estimation strategies, there is no single shared approach to guide empirical applications. One of the major issues in RD designs involves selection of the “window” or “bandwidth” — the values of the running variable that define the set of units included in the RD study group. [i]

This choice is key for RD designs, as results are often sensitive to bandwidth size. Indeed, even those who propose particular methods to choose a given window agree that “irrespective of the manner in which the bandwidth is chosen, one should always investigate the sensitivity of the inferences to this choice. […] [I]f the results…

View original post 2,474 more words

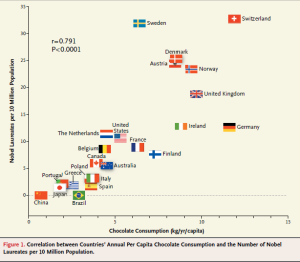
Eating chocolate has made the Swiss smarter. Really?

I found an article that studies the beneficial effect of chocolate consumption on cognitive function. To prove his theory, the author uses the correlation between countries’ annual per capita chocolate consumption and the number of Nobel Laureates per 10 million people. And…nothing else.

Correlation

Chocolate and Nobel Laureates

The study acknowledges some of its very obvious methodological limitations, but still concludes that “since chocolate consumption has been documented to improve cognitive function, it seems most likely that in a dose-dependent way, chocolate intake provides the abundant fertile ground needed for the sprouting of Nobel laureates.”

Now, for all we know the correlation is not “surprisingly powerful”, as the author concludes, but a mere coincidence. The many  non-sense correlation plots shared recently on social media have helped popularizing the idea that “correlation does not imply causation”.  The interesting fact about this article, however, is that it was published in the New England Journal of Medicine, one of the most prestigious medical journals in the world (featuring a staggering 54.42 (!!) impact factor). To be fair, the article is published as an “occasional note”, which also seems to serve as a humor section. If only all top-journals had such a twisted sense of humor!